Connect External BI System
 In today's fast-paced business environment, data
reigns supreme. The ability to gather, analyze, and leverage data effectively can make all the difference between thriving
and merely surviving.
In today's fast-paced business environment, data
reigns supreme. The ability to gather, analyze, and leverage data effectively can make all the difference between thriving
and merely surviving.
This is where Business Intelligence (BI) systems come into play, providing organizations with invaluable insights to drive strategic decisions and enhance your seller's performance.
By leveraging the combined power of the Showpad platform and the analytical prowess of BI systems, organizations can gain a deeper understanding of its sales processes, customer behavior, and content effectiveness.
Classic Situation
A company wants to combine its Showpad data with the data in its BI tool. This is generally a tedious manual process requiring them to:
- Export their data from Showpad
- Load the export into their data warehouse
- Transform the data
- Prepare/optimize queries
- Enrich with company-specific data
- Combine the data in their BI tool
- Create visualizations
With so many manual steps, the scene is ripe for errors and data contamination. They want to automate this integration to expedite insights generation and decision-making and optimize their sales strategies and operational efficiency.
An automated approach ensures that Showpad data seamlessly merges with their BI tool's dataset, empowering the company to harness a comprehensive view of their sales performance without cumbersome manual interventions.
Keep reading to see how Showpad simplifies this process.
SharePoint & PowerBI Example
- Plan: Ultimate | Advanced or Expert
- Permissions:
- Administrator access to Showpad's Admin App
- Administration rights to SharePoint and PowerBI
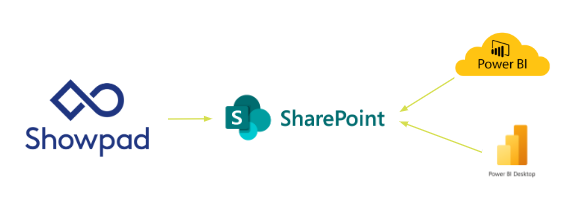
A Sharepoint integration enables you to continuously update your Showpad usage data with the Power BI service without additional infrastructure or software. You only need a publicly accessible Sharepoint.
The architecture for this setup looks like:
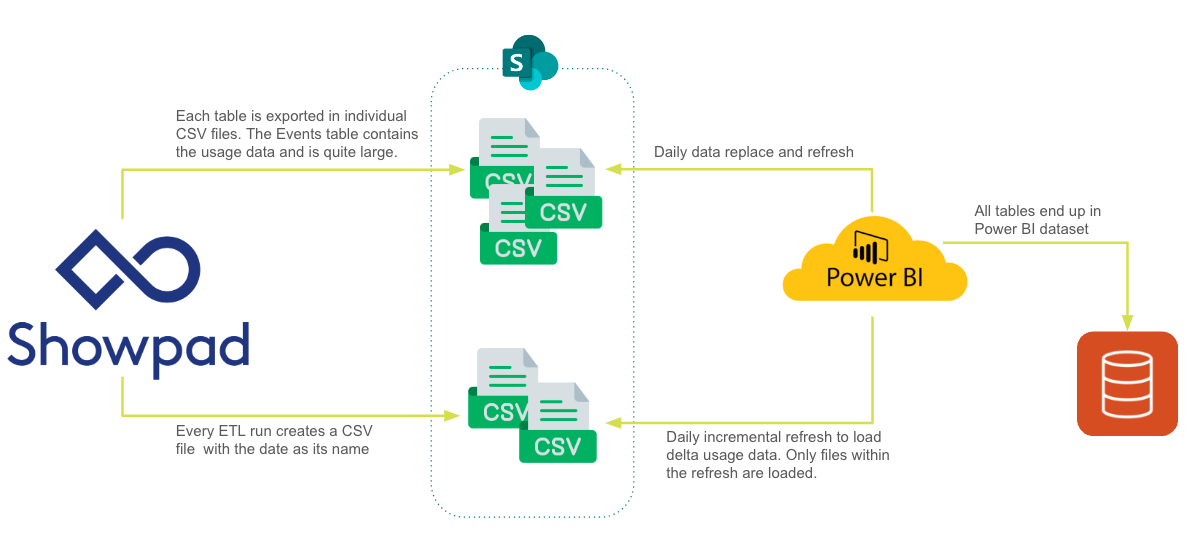
The major steps of the flow are:
- From Showpad, create daily ETL script to create CSV exports.
- Upload export files to SharePoint.
- Stage the data with incremental refresh (daily job) with the Power BI Service
- Use PowerBI service datastores for dashboards etc.
It typically looks like this:
Things to keep in mind:
-
Export all tables in CSV format.
-
The Events table will be very large. It's important that you consider incremental exports and how to incrementally update your BI events table. This is important for both exporting the data as well as for staging your files.
-
We recommend running an export once a day, always fetching the last full day.
-
Be sure to pay attention to time zones!
-
Name the Events CSV export file with the end date of the export range. Example:
├── assetAuthors.csv
├── assetCountries.csv
├── assetLanguages.csv
....
├── events
│   ├── 2023-08-06.csv
│   ├── 2023-08-07.csv
│   └── 2024-03-13.csv
  .....
The following sections demonstrate the essentials of connecting Showpad with a SharePoint data warehouse and PowerBI. Please note that this is not a complete step-by-step tutorial.
Showpad
-
If you don't already have SharePoint integrated with Showpad, open the Admin Settings of the Online Platform and enable a SharePoint integration. This article on our Help Center will walk you through it. You may need to collaborate with your Showpad admin.
-
Develop and configure a managed ETL script to extract Showpad data from Showpad API. Here are some helpful example queries to get you started.
For your synchronization script (see code example below), we recommend:
- Determine the last run date to calculate logged before / logged after parameters
- Download events usage data
- Download the other 21 tables from showpad to the disk
- Upload them afterward to Sharepoint (in chunks)
For exporting the Events table:
-
Export sync:
Example Sync Script
export async function events(
   showpadClient: ShowpadClient, // authenticated axios (http client) instance
   limit: number,
   startedAt?: string,
   endedAt?: string,
   loggedBefore?: string,
   loggedAfter?: string,
   scrollId?: string,
   scrollIndex?: number,
   ): Promise<{
   items: string
   scrollId?: string
   }> {
      const params = {
         limit,
         startedAt,
         endedAt,
         loggedBefore,
         loggedAfter,
         pageBased: true,
      }
      try {
         const response = await showpadClient.request.get<string>(
            `exports/events.csv`,
            scrollId
            ? { headers: { 'X-Showpad-Scroll-Id': scrollId }, params }
            : { params },
         )
         return {
            scrollId: response.headers['x-showpad-scroll-id'],
            items: response.data,
         }
      } catch (err) {
         console.error(`Failed to fetch events`, {
            err,
         })
         throw err
      }
} -
Here's a helper function to store the incremental results on disk. Without something like this, you run the risk of running out of memory.
Example Store to Disk Function
import fs, {createWriteStream} from 'fs'
export async function getAllInBatchWithScrollIdToDisk(
scrollFnBatch: ScrollFnBatch,
limit: number,
folderPath: string,
fileName: string,
) {
   if (!fs.existsSync(folderPath)) {
      fs.mkdirSync(folderPath, { recursive: true })
   }
         let hasMore: boolean | undefined
         let scrollId: string | undefined
         let scrollIndex: number = 0
         const writeStream = createWriteStream(`${folderPath}/${fileName}`, {
            flags: 'w',
         })
   do {
      scrollIndex += 1
      const response = await scrollFnBatch(limit, scrollId, scrollIndex)
      const { items, scrollId: currentScrollId } = response
      scrollId = currentScrollId
      const validatedHeaderItems =
         scrollIndex > 1 ? removeCsvHeader(items) : items
      hasMore = validatedHeaderItems.length > 0
      if (validatedHeaderItems) {
         if (scrollIndex === 1) {
         writeStream.write(validatedHeaderItems)
         } else {
         writeStream.write(`\n${validatedHeaderItems}`)
         }
      }
   } while (hasMore)
   writeStream.end()
} -
Here's a script to bring it all together:
Example Service Function
export const getEventsToDisk = async (
showpadClient: ShowpadClient,
folderPath: string,
fileName: string,
startedAt?: string,
endedAt?: string,
loggedAfter?: string,
loggedBefore?: string,
): Promise<void> => {
await getAllInBatchWithScrollIdToDisk(
   (limit, scrollId, scrollIndex) =>
      repo.events(
      showpadClient,
      limit,
      startedAt,
      endedAt,
      loggedBefore,
      loggedAfter,
      scrollId,
      scrollIndex,
      ),
   MAX_EXPORT_EVENTS_API_LIMIT,
   folderPath,
   fileName,
)
}
All other tables can be exported without needing an offset or scrollId:
Example Script
const assets =
async (showpadClient: ShowpadClient): Promise<string> => {
   try {
      const response = await showpadClient.request.get<string>(
      `exports/assets.csv`,
      )
               return response.data
            } catch (err) {
               console.error(`Failed to fetch ${exportApiEntity}`, {
               err,
               })
               throw err
            }
   }
SharePoint & PowerBI
SharePoint
-
Because you're the resource owner, we recommend using Sharepoint’s Client Credential flow.
Example Authentication Script
interface CredentialFlowDetails {
clientId: string
clientSecret: string
tenantId: string
scope: string
hostname: string
}
public static async authenticateWithCredentialFlow({
   clientId,
   clientSecret,
   tenantId,
   scope,
}: CredentialFlowDetails) {
   const url = `https://login.microsoftonline.com/${tenantId}/oauth2/v2.0/token`
   const data = `grant_type=client_credentials&client_id=${clientId}&client_secret=${encodeURIComponent(
      clientSecret,
   )}&scope=${encodeURIComponent(scope)}`
   const response = await axios.post(url, data, {
      headers: {
      'Content-Type': 'application/x-www-form-urlencoded',
      },
   })
   return response.data
} -
Next, you must upload your Showpad CSV export files to SharePoint. We recommend replacing all tables except the Events files.
Upload the Events data to SharePoint in chunks to avoide the API failing due to artifacts that are too big.Example Upload Script
export async function uploadFileInChunks(
   client: SharepointClient, // authenticated axios instance
   siteId: string,
   folderPath: string,
   fileName: string,
   contentStream: Readable,
   fileSize: number,
   chunkSize: number = 1024 * 1024 * 2,
): Promise<void> {
console.info('Upload:', {
   folderPath,
   fileName,
   FileSizeInMB: fileSize / 1000 / 1000,
   ChunkSizeInMB: chunkSize / 1000 / 1000,
})
   const encodedFolderPath = encodeURIComponent(folderPath) const url =
   `/sites/${siteId}/drive/root:${encodedFolderPath}/${fileName}:/createUploadSession`

      // Create an upload session const response = await client.request.post(url, { conflictBehavior: 'replace', })

      const { uploadUrl } = response.data

      let startByte = 0 let endByte = chunkSize - 1

      while (startByte < fileSize) { // Adjust endByte if it's exceeding the file size if (endByte >= fileSize) { endByte
      = fileSize - 1 }

      // Get the chunk to be uploaded const chunk = await readChunk(contentStream, chunkSize)

      // Upload the chunk const uploadResponse = await client.request.put(uploadUrl, chunk, { headers: { 'Content-Length':
      chunk.length, 'Content-Range': `bytes ${startByte}-${ startByte + chunk.length - 1 }/${fileSize}`, }, })

      const uploadedBytes = startByte + chunk.length

      console.info(`${Math.round((uploadedBytes / fileSize) * 100)}% uploaded...`) // Check if the upload is complete if
      (uploadResponse.status === 201 || uploadResponse.status === 200) {
      logger.info(`Upload of ${uploadResponse.data.name} complete`)
            return
      }
      // Move to the next chunk startByte += chunkSize endByte += chunkSize } }
PowerBI
Before using the CSV data, you need to use some PowerBI Desktop features to load and transform the data.
| Parameter | Data Type | Description |
|---|---|---|
RangeStart | Date/Time | The starting date to fetch the Events CSV files from SharePoint by date. This exact name is expected in the PowerBI service for the incremental refresh. Example 1/1/2020 12:00:00 AM |
RangeEnd | Date/Time | The ending date to fetch the Events CSV files from SharePoint by date. This exact name is expected in the PowerBI service for the incremental refresh. Example 1/1/2023 12:00:00 AM |
SharepointSiteUrl | Text | URL to your SharePoint site Example https://showpad365.sharepoint.com/sites/showpadUsage |
projectRoot | Text | Name of the folder where your CSV export files are stored. Example export_data |
-
Upload files
-
All tables except Events
The following code snippet (Advanced Query) loads theusers.csvfile from your SharePoint via the Sharepoint Connector and creates a table. We recommend building one query per table / .csv file.All tables except Events
let CsvFileName = "users.csv", Source = SharePoint.Files(SharepointSiteUrl, [ApiVersion = 15]), #"Filtered Rows" =
Table.SelectRows(Source, each ([Folder Path] = SharepointSiteUrl & "/Shared Documents/" & projectRoot & "/" )),
#"Selected File" = #"Filtered Rows"{[Name=CsvFileName, #"Folder Path"=SharepointSiteUrl & "/Shared Documents/" &
projectRoot & "/"]}[Content], #"Imported CSV" = Csv.Document(#"Selected File",[Delimiter=",", Encoding=65001,
QuoteStyle=QuoteStyle.None]), #"Promoted Headers" = Table.PromoteHeaders(#"Imported CSV",
[PromoteAllScalars=true]), ColumnNames = Table.ColumnNames(#"Promoted Headers"), ColumnTypesAsAny =
List.Transform(ColumnNames, each {\_, type any}), #"Changed Type" = Table.TransformColumnTypes(#"Promoted Headers",
ColumnTypesAsAny) in #"Changed Type" -
Events table
As the Events table grows, we recommend incrementing the usage data instead of fully loading the entire table. This is the reason behind creating one CSV file per export and name the file with theloggedBeforedate.Events table
let Source = SharePoint.Files(SharepointSiteUrl, [ApiVersion = 15]),
#"Filtered Rows (with Variables)" = Table.SelectRows(Source, each ([Folder Path] = SharepointSiteUrl & "/Shared Documents/" & projectRoot & "/" & "events" & "/")),
#"Inserted Text Before Delimiter" = Table.AddColumn(#"Filtered Rows (with Variables)", "Date", each Text.BeforeDelimiter([Name], ".csv", {0, RelativePosition.FromEnd}), type text),
#"Changed Type" = Table.TransformColumnTypes(#"Inserted Text Before Delimiter",{{"Date", type date}}),
#"Change date type" = Table.TransformColumnTypes(#"Changed Type",{{"Date", type date}}),
#"Filter date by RangeStart and RangeEnd" = Table.SelectRows(#"Change date type", each [Date] >= Date.From(RangeStart) and [Date] < Date.From(RangeEnd)),
#"Filtered Hidden Files1" = Table.SelectRows(#"Filter date by RangeStart and RangeEnd", each [Attributes]?[Hidden]? <> true),
#"Invoke Custom Function1" = Table.AddColumn(#"Filtered Hidden Files1", "Transform File", each #"Transform File"([Content])),
#"Expanded Transform File" = Table.ExpandTableColumn(#"Invoke Custom Function1", "Transform File", {"Event id", "Start time", "End time", "Logged at", "User id", "Channel id", "Share id", "Shared Space ID", "Shared Space Participant ID", "Device id", "Division id", "Asset id", "Contact id", "Type", "Page","Metadata"}),
#"Removed Columns" = Table.RemoveColumns(#"Expanded Transform File",{"Content", "Name", "Extension", "Date accessed", "Date modified", "Date created", "Attributes", "Folder Path", "Date"})
in #"Removed Columns"
-
-
Transform files
The following helper function/query will load the csv binaries within the date ranges.Transform File Function
  let Source = (Parameter1 as binary) => let Source = Csv.Document(Parameter1,[Delimiter=",", Columns=29, Encoding=65001,
  QuoteStyle=QuoteStyle.Csv]), #"Promoted Headers" = Table.PromoteHeaders(Source, [PromoteAllScalars=true]) in #"Promoted
Headers" in Source -
Incremental refresh settings
Once the Events table is created, you need to adjust the incremental refresh setting before pushing this to the PowerBI service. Here, you define theRangeStartandRangeEndvalues the service will populate for the initial and incremental loads.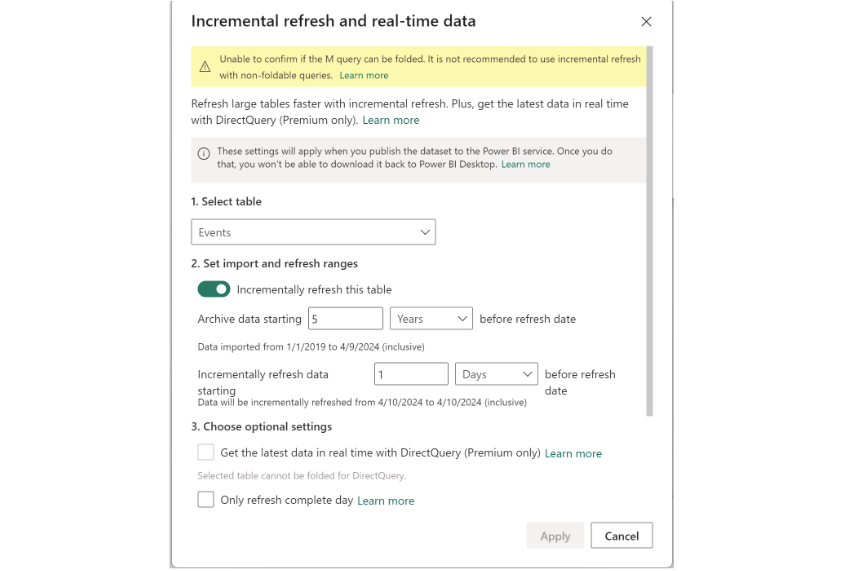
-
Create incremental refresh
The last step is to define the incremental refresh for all tables. It's essential to run them on a daily basis.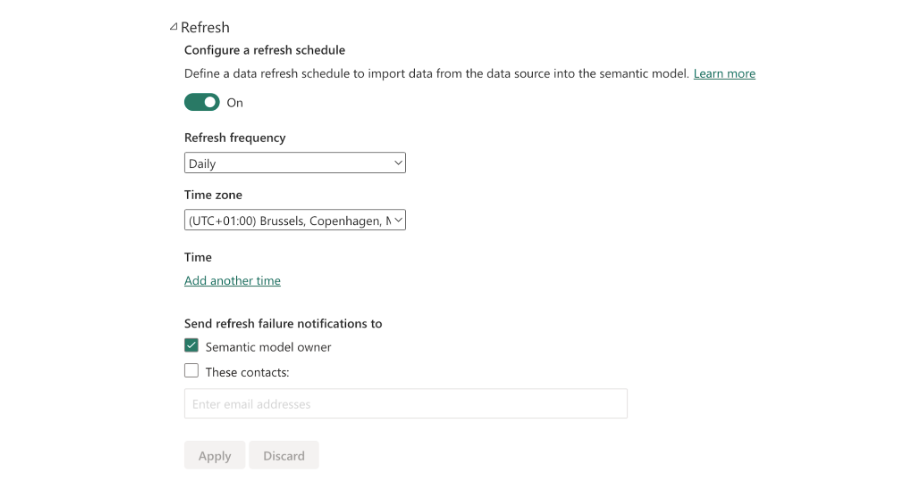
And that's it! Once you've got everything set up and running smoothly, valuable insights from your own custom analytics are at your fingertips .
If you need assistance connecting your BI system to Showpad, please reach out to Showpad.