Testing Your Showpad App
Local Testing
In order to test an Extension locally, your app must include the corresponding Extension Type. For example, if you want to test an Admin Settings extension, you app must include an the Admin Settings extension type.
The following steps demonstrate testing an Admin Settings extension:
-
In the root folder of your app, run your extension locally by starting your local server.
-
In the Admin App, click the gear icon to open Settings.
-
In the Showpad Apps section, select your extension and click the code icon (
</>):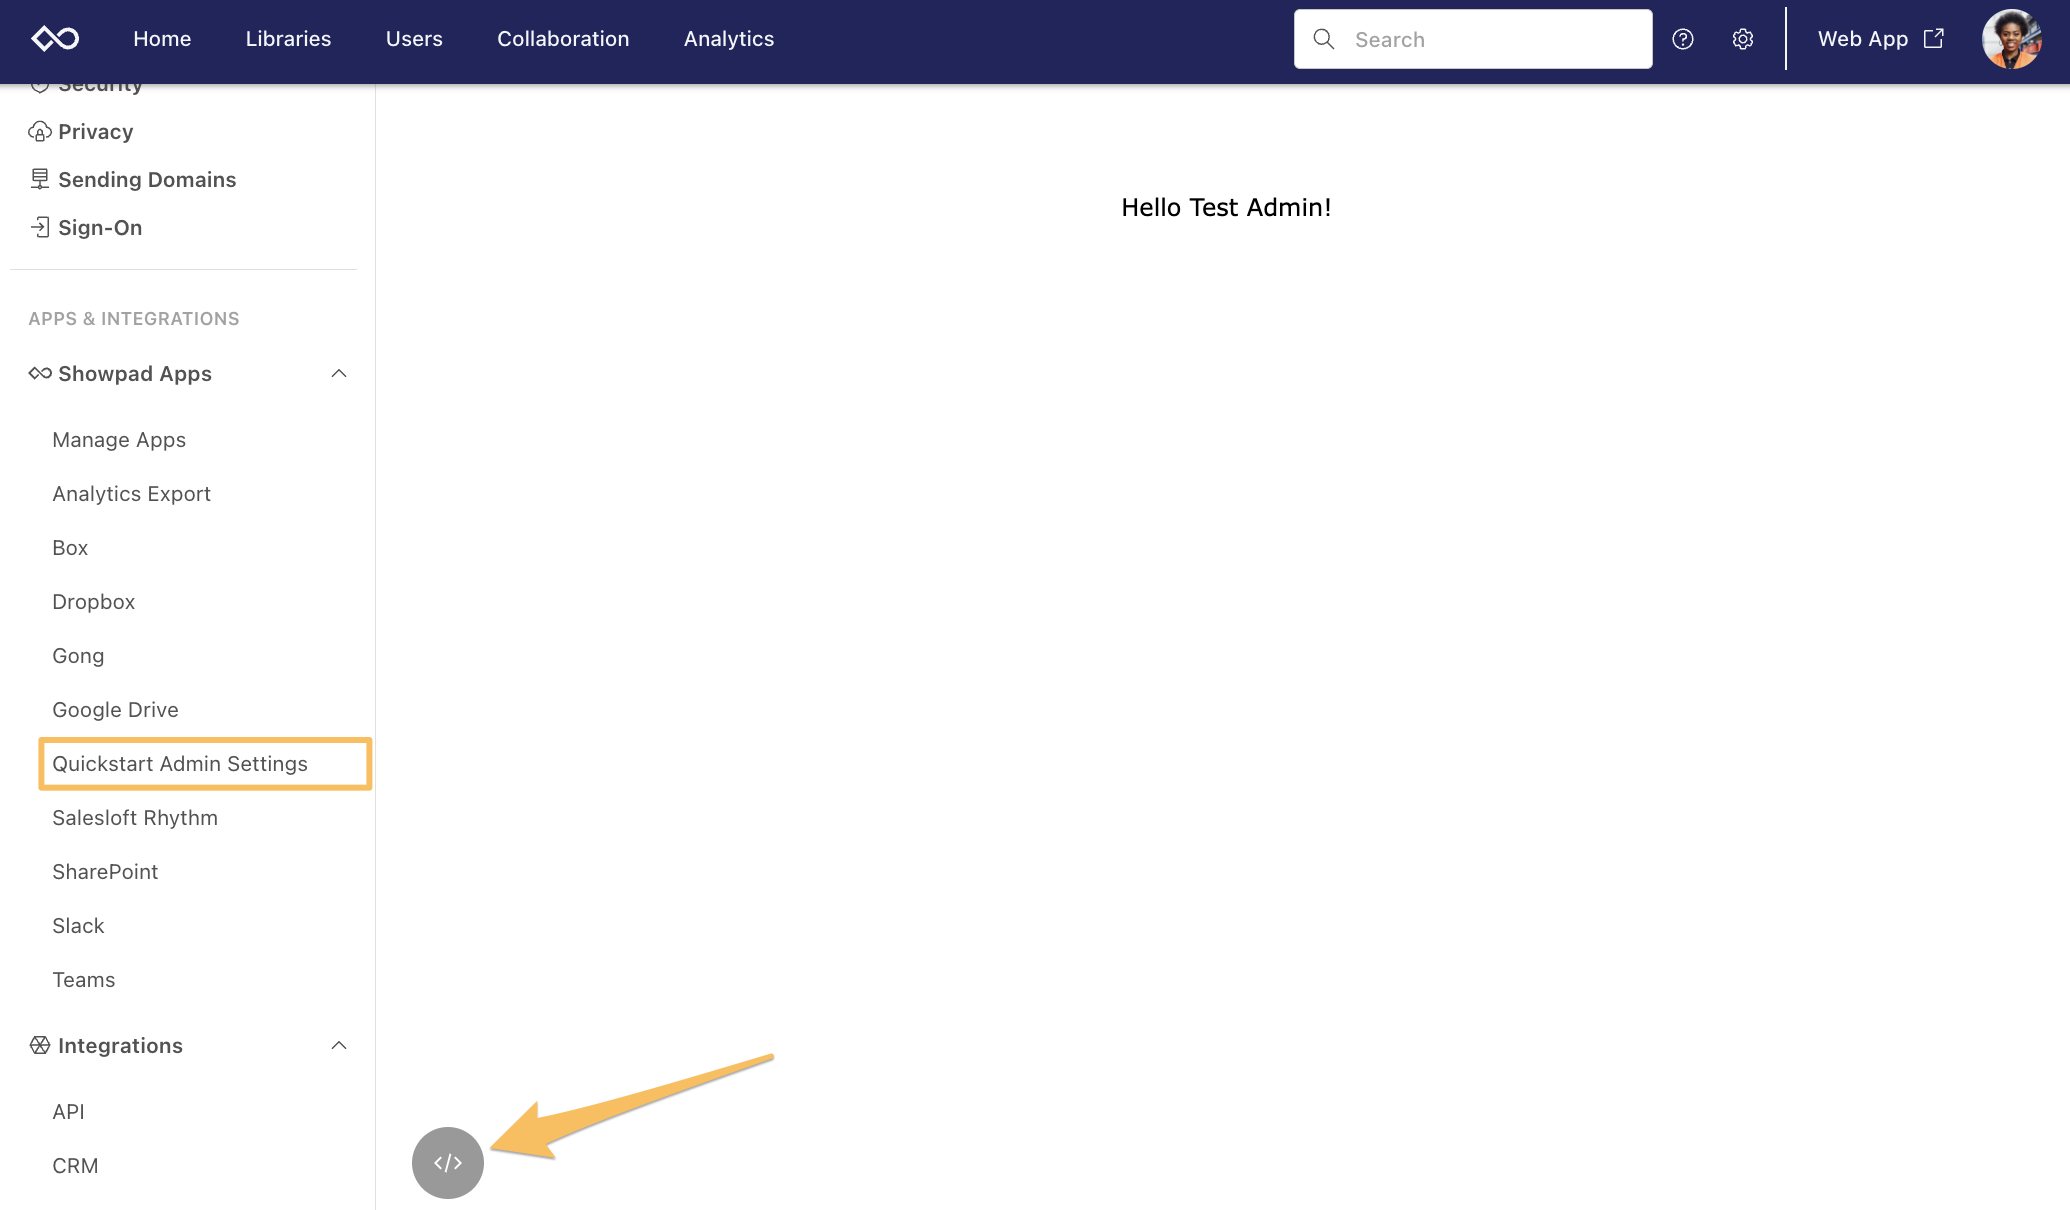
-
Enable developer mode by entering the URL of your local host to render it within the Showpad platform:
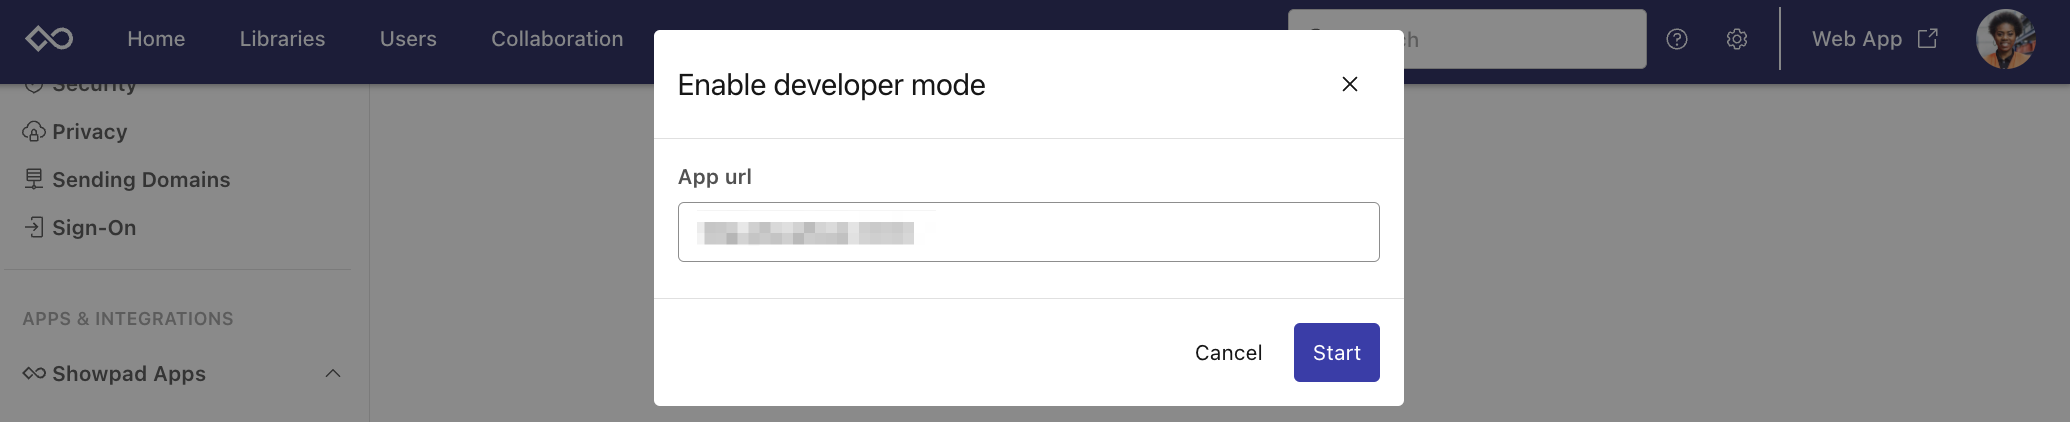
That's it! You're ready to test your app locally.
If you don’t have an appropriate Extension Type in your app yet, you can use our Testing App:
Staging
Nearly all modern web browsers include powerful developer tools to inspect HTML, CSS and JavaScript. These tools enable you to directly interact with the source code so you can track down issues and ensure that your Showpad App works correctly.
Mobile
Showpad provides user-friendly interfaces that resemble the developer tools found in desktop web browsers. Once your device is connected, you can interact with your web content in real time.
This great feature makes it easier to diagnose and fix issues during the development stage on:
- Pages
- Experiences
- Customizable HomePages
Please contact your Showpad Customer Success Manager if you're interested in using this feature.
iOS - Web Inspector
- Basic understanding of Web debugging skills
- iOS/iPadOS 16.4 or later
- Running MacOS
- Safari browser or Safari technology preview
- Showpad iOS app version 8.14.0 or later
Web Inspector provides an easy and practical way to inspect the resources and activity on a web page. You can leverage this handy tool to inspect elements and debug specific issues.
Enable the inspector
To activate the inspector:
|  |
Open the inspector
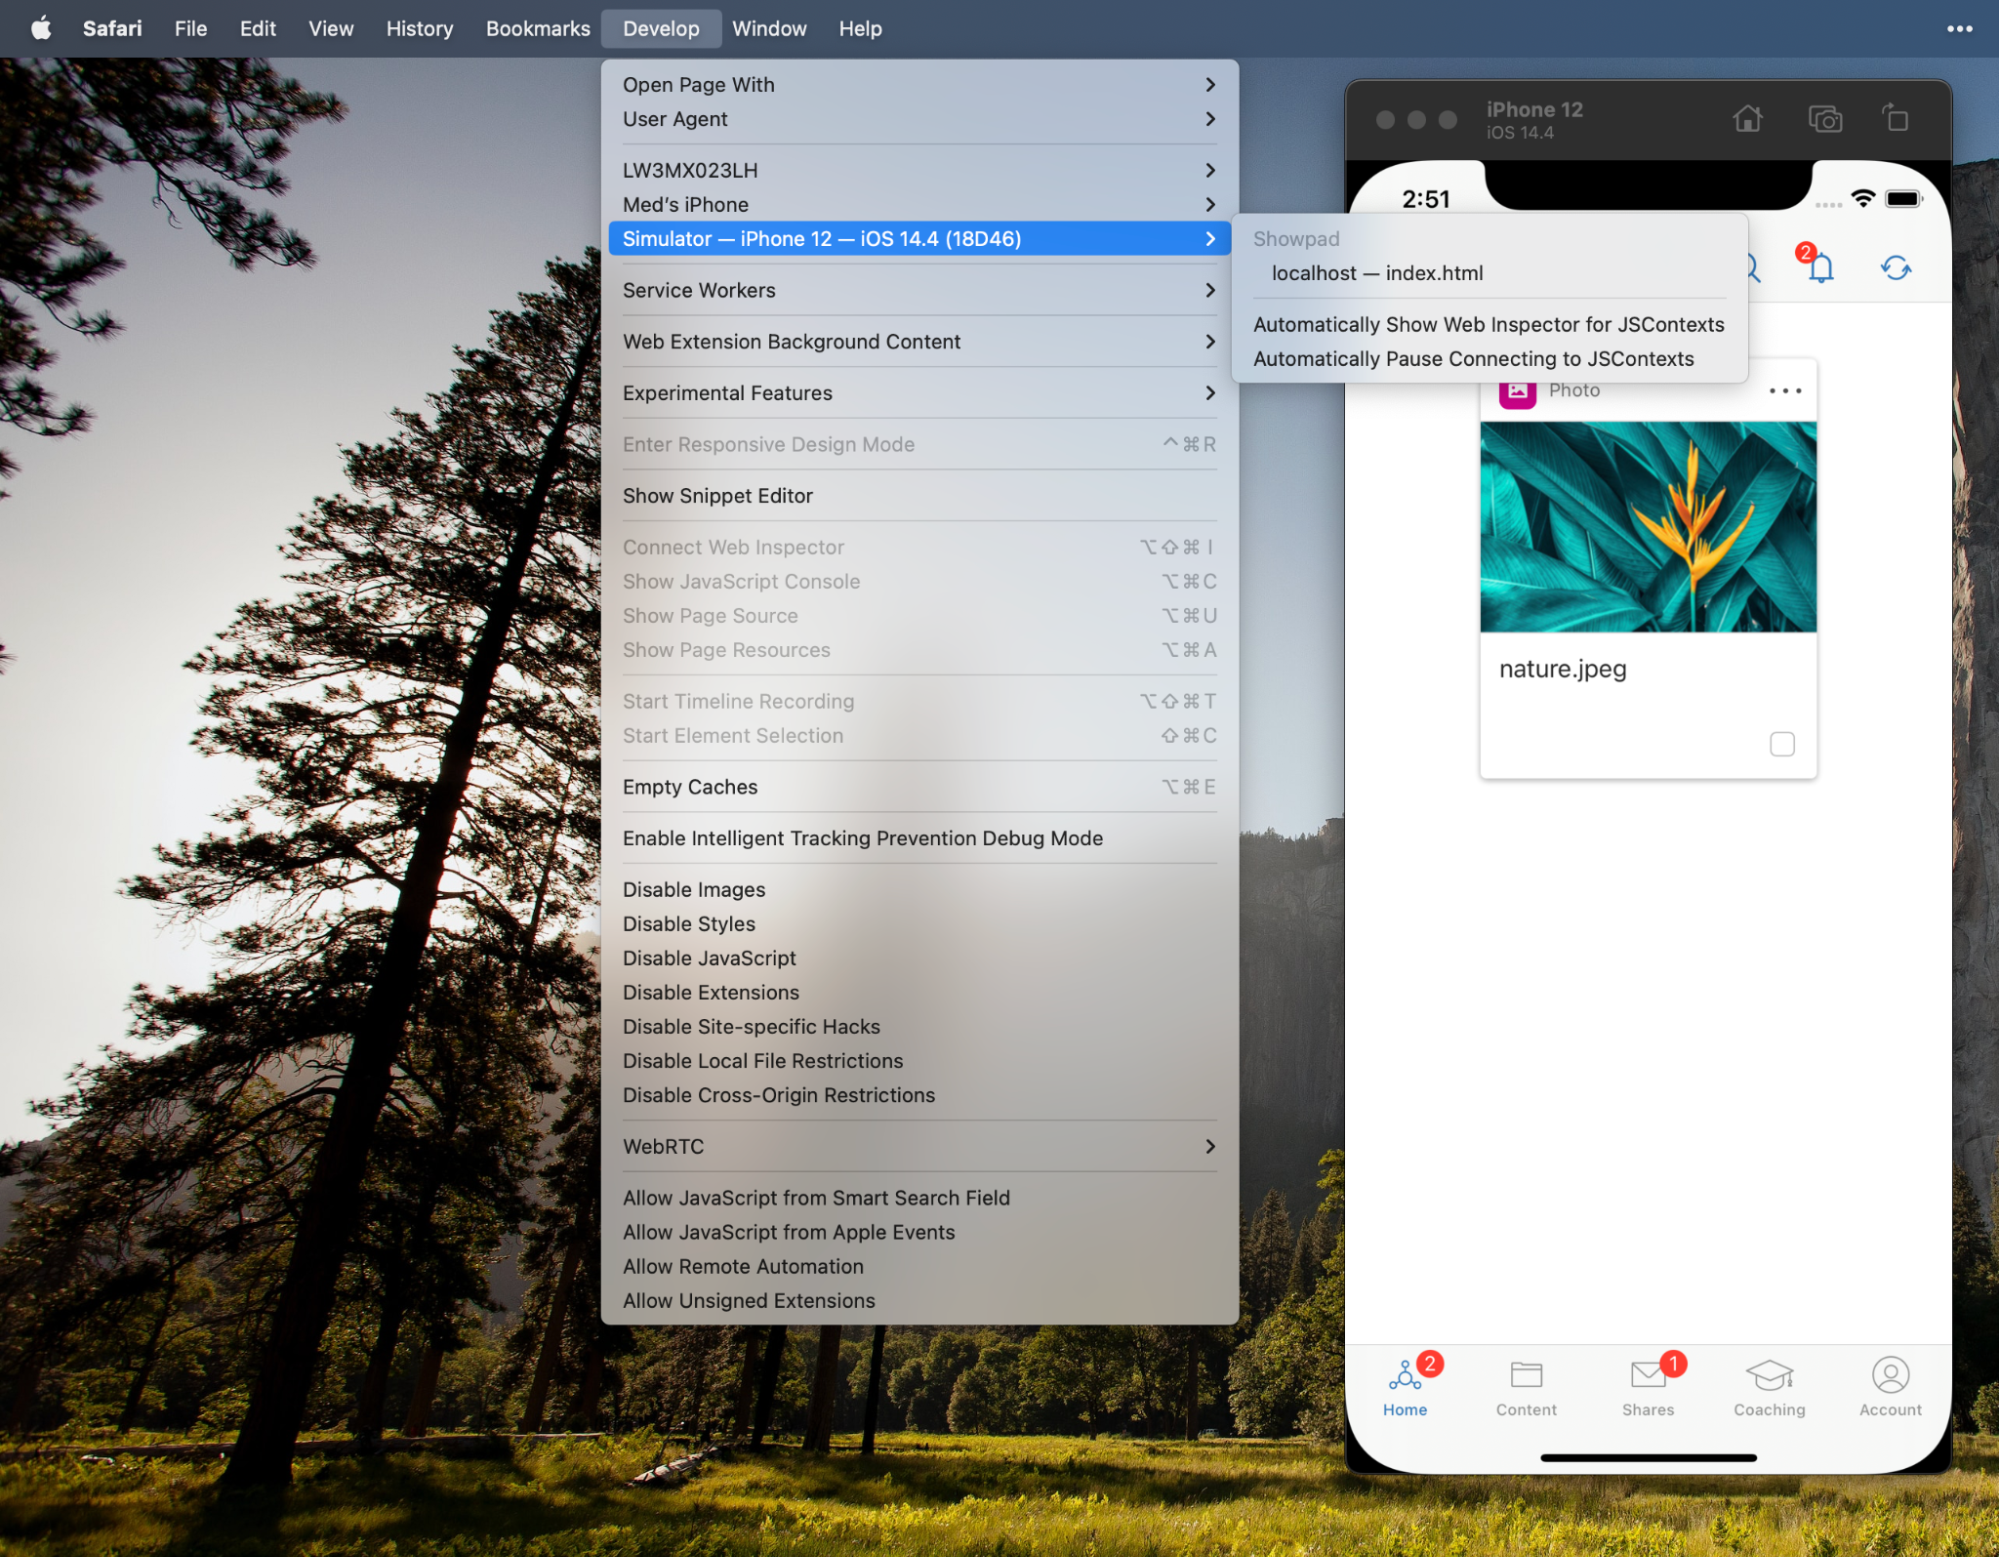
To access the inspector:
-
Connect your iOS device to your Mac.
-
Open the Page/Experience/Customizable HomePage you want to debug in the Showpad Web App and make sure that it stays open.
-
In Safari's developer menu, locate your device's name, and open the inspector from there.
Troubleshooting
| Issue | Solution |
|---|---|
| You have connected your device and are not seeing the inspector. | Unplugging and replugging your device usually resolves this issue. |
| You are running a beta iOS or iPadOS version. | Be sure to use Safari technology preview. |
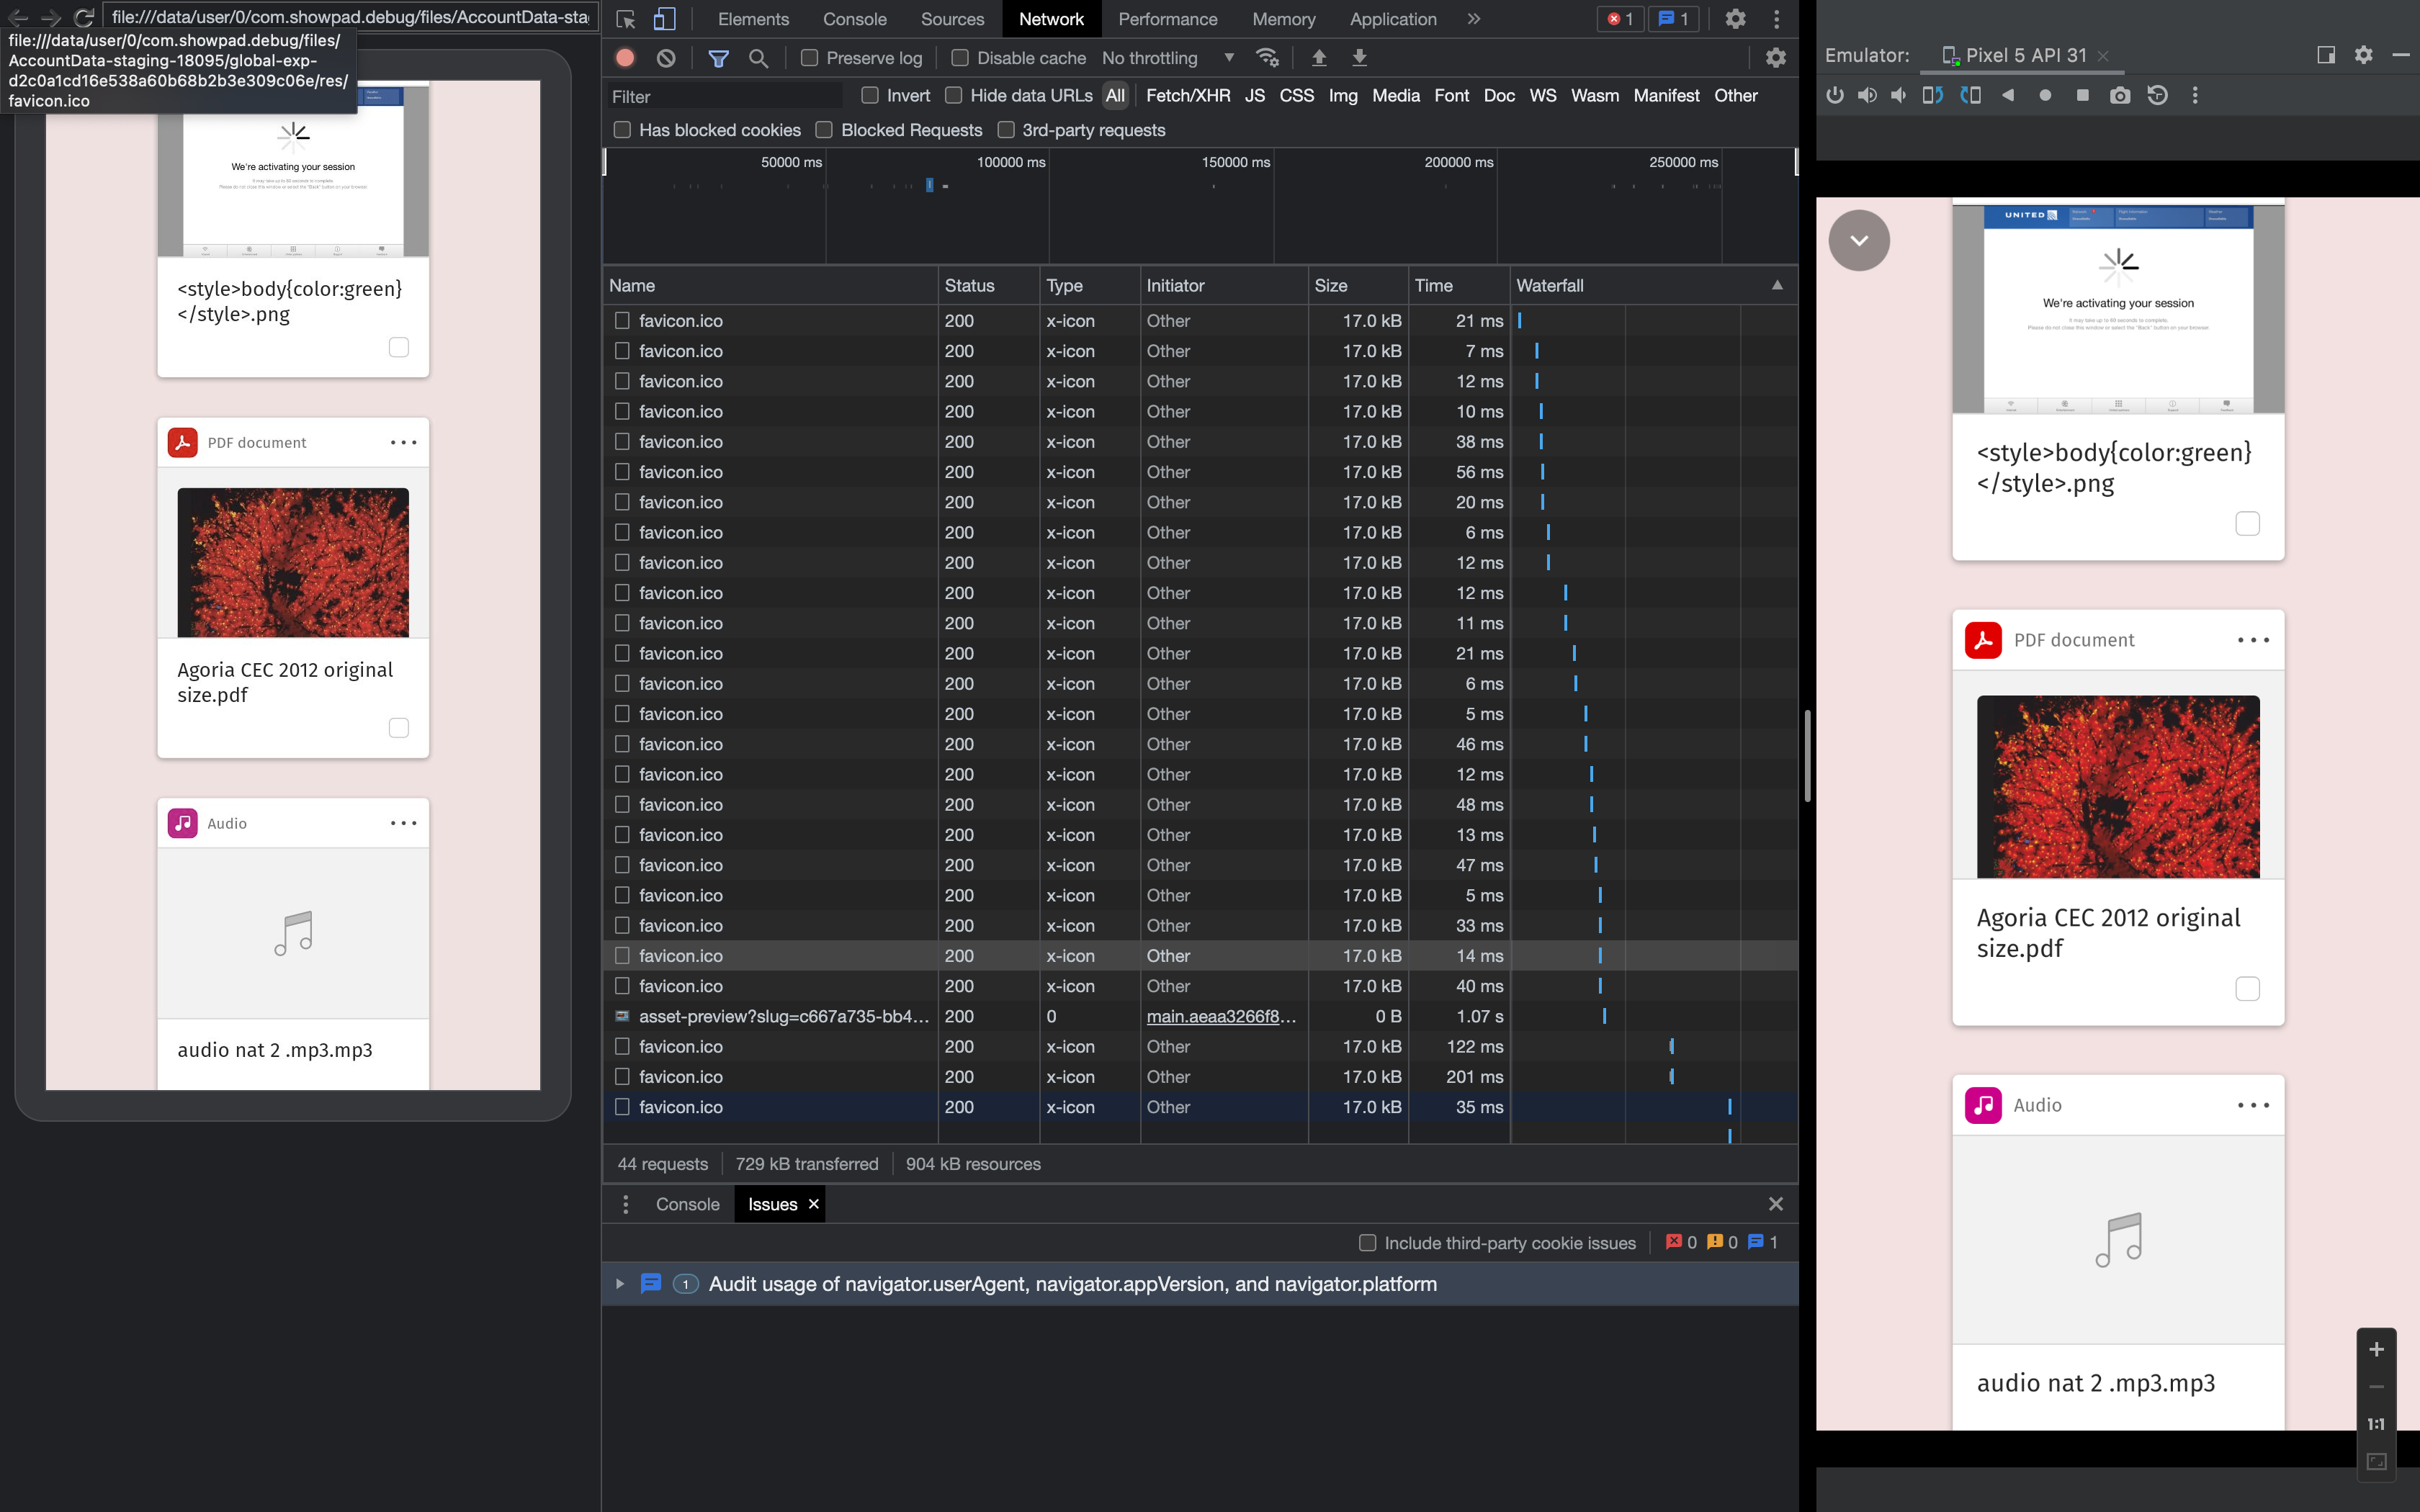
Android - Inspect WebViews
Chrome DevTools is a set of web developer tools built directly into the Google Chrome browser. DevTools can help you edit pages on-the-fly and diagnose problems quickly, which ultimately helps you build better websites, faster.
One of these tools is WebViews. They're used to display the web pages within an application. This allows you to inspect and debug your custom Showpad Apps while they run within the Showpad Android application.
- Basic understanding of Web debugging skills
- Showpad Android app version 5.6.0 or later
- Chrome browser
Enable USB Debugging
Perform the following steps on your Android device:
|  |
Discover Device
-
In a Chrome browser search bar on your device, enter: “chrome://inspect"
-
Connect your Android device to your development machine. If you are connecting your device for the first time, the device will show up as "Offline" and pending authentication.
-
Under the WebView you want to debug, click Inspect.
Troubleshooting
| Issue | Solution |
|---|---|
| You have connected your device and are not seeing the WebViews. | Unplugging and replugging your device usually resolves this issue. |
| USB Debugging is enabled, but won't connect. | You can try one of the following options:
|